
Part 1 - "Dot Donutting" or "Haloing"
(Part 1 of a 5 part series)
Impression is just one of a multitude of factors needed to control the perfect dot. Daily we strive to achieve the all too elusive "kiss impression", the minimum amount of pressure needed to achieve sufficient ink transfer to the substrate. But how much does each extra thousandth of impression really influence the image? Under impression is fairly obvious as voids in the printed image appear. So how can be better recognize, and even more importantly measure, over impression?
In line art and text, excess impression appears as a "halo" around the print. A halo is described as an undesirable peripheral outline of the printed image. In process and screen art, excess impression appears as "dot donutting". Dot donutting is a result of the impression pressure being so great that the ink is squeezed from the center to the edges of the dot. This produces a ring around the circumference of the dot, with the ink density being lighter in the center. So how do we measure this dot donutting effect? Measuring a tonal patch with reflective densitometer may be of some help; however, while a densitometer may show a change in density as a result of the donutting, it doesn't specifically identify what is causing the shift in density. A change in density or dot size could be a result of several press components or press settings.
By using Quality Engineering Associates' (QEA) Image Analysis System (Flexo IAS) we can now create a dot profile, which can be accomplished in three easy steps.
Step 1: The first illustration, Figure A, was taken by QEA's IAS at a standard 50x magnification. The print measurements pertaining to dot percentage, slur, circularity, lpi, perimeter, and square micron ink coverage are displayed in the lower section of the screen.
Step 2: In the second illustration, Figure B, the magnification has been increased 4x beyond the standard magnification. We can now select an area right through the center of any dot to obtain information about the uniformity of density across the face of that dot.
Step 3: We can now graph a profile of that dots degree of uniformity. The third illustration, Figure C, illustrates an ideal dot profile. This dot has a uniform distribution of ink, meaning a solid dot with no dot donutting. The forth illustration, Figure D, is the dot profile of the dot selected in Figure B. We have always understood that dot donutting creates adverse effects in a printed image. But, now, for the first time, we can measure the degree of donutting, and therefore better control our process. Over time, as we create a history with these measurements, we can establish an internal tolerance for an acceptable printed dot profile that is realistic and repeatable within our unique printing environment.
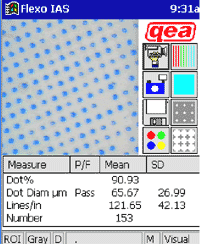
Figure A
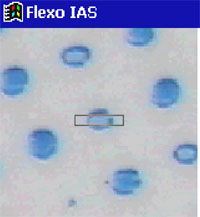
Figure B
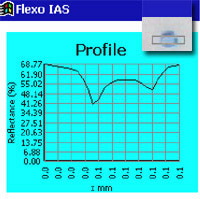
Figure C
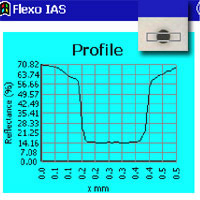
Figure D