
(Part 3 of a 5 part series)
Maintaining the perfect dot is not easy, and to do so we must control several factors, one of which is standard dot size. More specifically holding dots within a tonal patch to have the same diameter measurement, or at the very least, a similar measurement.In theory we would hope that dots within a tonal patch would have an identical measurement across the face of the dot. But in the real world this isn't the case. Film negatives, photopolymer plates, and printed samples can contain missing, bridging, slurring, or fragmented dots, which affect the deviation of dot size.
When an IAS (Image Analysis System) calculates the Diameter Mean, the Diameter = the sq. root of 4A (area) divided by p. Mean is the average dot diameter measurement, which is typically measured in microns (mm). The Standard Deviation (SD) is how much that average diameter differs (standard deviation) between the total number of dots analyzed.
Quality Engineering Associates (QEA) has developed an Image Analysis System (Flexo IAS) that measures a many of print characteristics on film negative, plate, and print. One of these print-measuring features is the measurement of Diameter Mean compared with the Standard Deviation between the total number of dots analyzed.
As you can see in the images to the left, each measurement of film negative (Image A), photopolymer printing plate (Image B), and printed tonal patch (Image C) includes the Diameter mm, followed by the SD. In addition to the numerical values, the IAS also plots a Dot Size Image Histogram (Image D - correlating to printed data in Image C).
Things to remember: SD within a film negative should be a small percentage of the Mean (< 10%). SD within printing plates and printed substrate is driven by the tonal scale and therefore the SD tolerances are non-linear. Deviations within a tonal patch of over 15% of the Mean can most often be recognized as a problematic sample.
Figure D
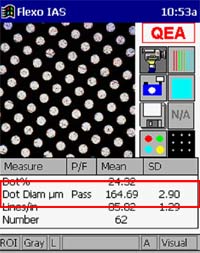
Figure A
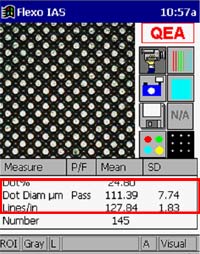
Figure B
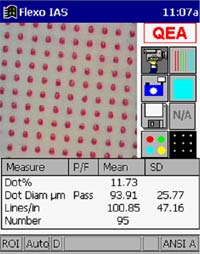
Figure C