
(Part 2 of a 5 part series)
Maintaining the perfect dot is not easy, and to do so we must control several factors, one of which is slur. Slur is the elongation of a dot and can happen in both machine direction and across the web. However, slur is more common in the machine direction. Causes of slur include but are not limited to, running components out of pitch, lack of support (shoulders) on the printing plate, speed match problems between rollers, and apparent tension (touching the web) being too low. While the causes are many, our means of measuring this print fault remains primitive. We typically identify slur when it becomes visually apparent or when our dot reading device indicates that we have an increase to our dot %. However, just knowing that there is an increase in dot percentage does not exactly point you towards slur as a print fault.
APR utilizes the QEA Flexo IAS for measurement of slur as a percentage and in what direction to the printed web slur occurs.
Think of a Box Ratio in these simple terms. If you have the "perfect dot", it is perfectly round (no elongation), therefore if you "boxed in" or drew a box around the dot where four points of the dot touch the sides of the box, you could then assume you would have a box in which horizontal and vertical axes are equal to one another. This would be a 1:1 ratio (or a Box Ratio of 1.00). See Figure A.
In Figure B you will notice the image taken at a standard 50x magnification. Along with print measurements pertaining to dot %, slur, circularity, lpi, perimeter, and sq. micron ink coverage is "Box Ratio" (Figure C). Think of a Box Ratio in these simple terms. If you have the "perfect dot", it is perfectly round (no elongation), therefore if you "boxed in" or drew a box around the dot where four points of the dot touch the sides of the box, you could then assume you would have a box in which horizontal and vertical axes are equal to one another. This would be a 1:1 ratio (or a Box Ratio of 1.00). Here we see the Box Ratio is .79 in the machine direction.
Figure D indicates the adverse affect that slur may have relating to dot gain, uniformity, and clarity. While the Graph in Figures E and F illustrate the uniform density carried across the face of a good dot vs. a slurred dot. There is little question that slurring can have very adverse affects on the printed product. Now for the first time you can measure the degree of slur, and therefore better control your process before it reaches a level of unacceptability.
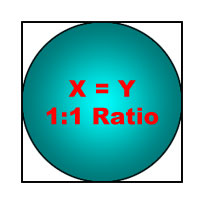
Figure A
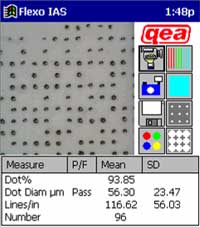
Figure B
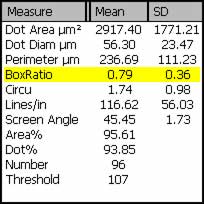
Figure C
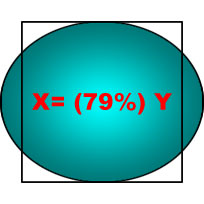
Figure D
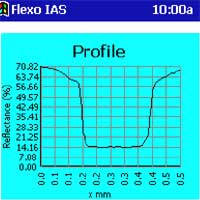
Figure E
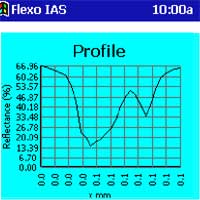
Figure F